
Link in bio traffic sources are the reports that show where your bio page visitors came from: which platform or website referred them, which country they are in and which device they used. Read together with views and clicks per block, they tell you which channel is worth more posts. Expect “direct” to be larger than it should be, because in-app browsers often pass no referrer.
You check your bio page stats, see 2,000 views, and still cannot say whether Instagram, TikTok or your newsletter earned them. A single total is a scoreboard with no names on it. The source, country and device splits are what turn it into something you can act on.
This guide walks through the five reports a link in bio analytics dashboard usually has, how to read each one, and the two traps that distort them: inflated direct traffic and bounce rate on a one-page site. For the click-tracking basics, start with how to track link in bio clicks. This piece goes one level deeper, into where the traffic comes from.
Key Takeaways
- Five reports cover most questions. Overview over time, traffic sources, location, devices, and clicks per block.
- Direct traffic is partly hidden social traffic. In-app browsers and privacy defaults strip referrers, so tag your bio links with UTM parameters.
- Bounce rate on a bio page is mostly the inverse of clicks. On a one-page site, a visitor who taps nothing is the bounce. CTR per block is the more useful number.
- AI assistants are now a source. Count referrals from ChatGPT and similar tools separately, and keep AI crawler reads out of your human views.
- Read trends, not days. Compare weeks and months, and change one thing at a time.
What are link in bio traffic sources?
Link in bio traffic sources are the referrers that sent each visit to your bio page: social platforms such as Instagram, TikTok, Threads, X, LinkedIn and Bluesky, other websites, apps, email, and direct visits with no referrer. Most dashboards group visits by source, then let you split them further by country and device, so you can see which channel brings visitors who tap.
Most tools sort the referrers into a few groups:
| Group | What it holds | What to watch for |
|---|---|---|
| Social | Instagram, TikTok, X, Threads, LinkedIn, Bluesky | The group you post in most, so compare clicks per visit |
| Websites and apps | Blogs, forums, other link pages, messaging apps | Small today, but a link from one article can send visits for months |
| Newsletter and email footer links | Often the fewest visits and the most clicks per visit | |
| AI assistants | Visits from an answer that cited your page | Count apart from search and social |
| Direct | No referrer was passed | Partly hidden social traffic, see the section on direct traffic below |
The five reports in a link in bio analytics dashboard
| Report | Question it answers | What to do with it |
|---|---|---|
| Overview over time | Is traffic growing, and when did it spike? | Match spikes to the posts that caused them |
| Traffic sources | Which platform or site sent visitors? | Post more where visitors arrive and tap |
| Location | Which countries are visitors in? | Time posts and pick languages, currencies, shipping |
| Devices | Phone or desktop, which browser and OS? | Test the page on the setup most visitors use |
| Clicks per block | Which links get tapped, and how often per view? | Move winners up, cut or regroup the rest |
The sections below go through each one in order.
1. Overview over time
The overview shows total views and clicks per day, week or month. Use it to find spikes, then ask what you posted that day. A 90-day view smooths out the noise of a single viral post. A daily view is for checking a launch.
How far back you can look depends on the tool and the plan. More.You keeps 30 days of analytics history on Free, one year on Pro and the full history on Premium (more.you/pricing, November 2026).
2. Traffic sources
The sources report ranks referrers by visits. If you post mostly on one or two platforms, expect them at the top, then a long tail of websites, apps and email.
Look at clicks per visit by source, not only visits. A platform that sends half your views but few taps is sending browsers. A newsletter that sends 5% of views but the most clicks per view is sending buyers. Read the full method in measuring social media conversions.
3. Location
The location report shows which countries your visitors are in. Treat it as a planning tool. If a third of visitors are in a time zone six hours from yours, your posting schedule is missing them. If you sell physical products, it also shows which shipping regions matter.
4. Devices, browsers and operating systems
On a bio page, mobile usually dominates, because the link lives inside phone apps. The device split tells you whether that holds for your audience. Some dashboards go further and split by browser and operating system, which helps when a block misbehaves on one setup only, such as a button that renders on Android but not on iOS.
5. Clicks per block
This is the report closest to money. It shows how many times each link, product or other block was tapped. Divide clicks by page views to get click-through rate per block, and compare blocks against each other. A block in slot two with a lower CTR than a block in slot seven is in the wrong slot.
More.You reports page views, clicks and CTR per block, with breakdowns by source, device and country, on every plan. Post-level attribution is on Pro. Both are described on the analytics and attribution page.
A worked example: reading the source report
For illustration, take a bio page with 2,000 views in one week. The sources report shows this.
| Source | Views | Clicks | Clicks per view |
|---|---|---|---|
| 900 | 90 | 10% | |
| Direct | 700 | 35 | 5% |
| TikTok | 300 | 9 | 3% |
| Newsletter | 100 | 30 | 30% |
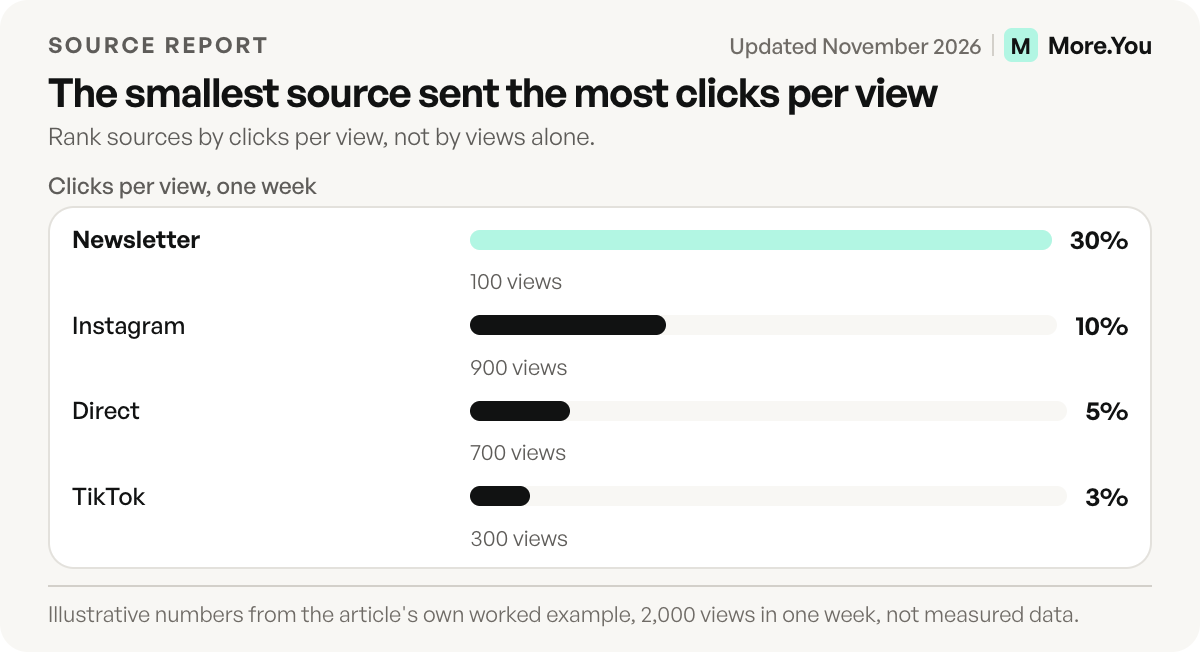
Instagram sent the most views, and the newsletter sent the most clicks per view. TikTok sent 15% of the views and 5.5% of the clicks. The newsletter sent 5% of the views and 18% of the clicks. These numbers are made up to show the method.
The decision is small. Put the newsletter link in more emails, and change the TikTok bio link text to name the one block you want tapped. Then wait a week and compare. Direct is the row to tag first, because 700 views with no name could hold Instagram and TikTok visits.
Why “direct” traffic is bigger than it should be
Direct means the visit arrived with no referrer. On a website, that suggests someone typed the URL. On a bio page, it often means something else.
Two mechanisms hide the real source. Browsers now default to the strict-origin-when-cross-origin referrer policy, which sends only the origin to another site and drops the path and query string (developer.mozilla.org, November 2026). And apps that open links in their own in-app browser do not always pass a referrer at all. A tap from your Instagram bio can land in your report as direct.
The fix is to put the source in the link itself. Add UTM parameters to the bio link on each platform, for example:
?utm_source=instagram&utm_medium=bioThe parameters travel in the URL, so they survive when the referrer does not. The full setup is in the guide to UTM parameters for creators.
Bounce rate on a one-page site
Bounce rate means different things in different tools, so check the definition before you compare numbers. In Google Analytics 4, an engaged session lasts longer than 10 seconds, has a key event, or has two or more page views, and bounce rate is the percentage of sessions that were not engaged (support.google.com, November 2026).
On a bio page, the second page view never happens, because the visitor leaves for your shop or video. So by most definitions a bounce on a bio page means a visitor who left without tapping anything.
That makes bounce rate roughly the mirror image of your page-level click rate. It tells you how many visitors found nothing worth tapping. CTR per block tells you which blocks worked, which is the question you can act on.
Google’s page adds that most reports in Google Analytics do not show bounce rate by default. You add it to a detail report such as Pages and screens with the Customize report button, and you need an Editor or Administrator role. Your bio tool’s own dashboard may not show it at all.
AI assistants as a traffic source
AI assistants now send visitors and read pages. Count these two things separately.
AI referrals are humans who clicked through from an assistant’s answer. ChatGPT has appended the tag utm_source=chatgpt.com to links it cites, though analysts reported a week in October 2026 when the tag stopped appearing and visits showed as direct (evertune.ai, November 2026). Watch for both patterns.
AI crawler reads are not visitors at all. If your dashboard counts them as views, your traffic is overstated, so check how your tool treats known bots. On More.You, you can see how often AI crawlers read your page. The AI referral traffic guide explains how to read both numbers.
Filters, privacy and tracking codes
Two practical questions come up once you start reading these reports.
Filtering. The most useful dashboards let you narrow the whole view to one source, country or device, so you can ask “how do TikTok visitors on phones behave?” If your tool does not filter, compare the breakdowns side by side for the same date range.
Privacy. Built-in bio page analytics need no tracking script from you. If your audience is in the EU, check what the tool collects and how it documents it. The comparison of GDPR documentation across link in bio tools covers the questions to ask.
Turn the reports into one decision a week
Analytics only pay off when they change what you post. Once a week, answer three questions:
- Which source sent the most clicks, not views?
- Which block lost its place, by CTR, and should move down?
- Did a post create a spike, and can you make another one like it?
The source report tells you which platform worked. More.You’s post-level attribution, on Pro and Premium, goes one step further and ties clicks back to the specific post that drove them. If you want sources, block CTR and AI crawler reads in one place, create your More.You page.
FAQ
How do I see where my link in bio traffic comes from?
Open your bio tool’s analytics and find the traffic sources report. It ranks visits by referrer, such as Instagram, TikTok, other websites and direct. Add UTM parameters to each platform’s bio link for cleaner data.
Why is most of my link in bio traffic direct?
In-app browsers often open links without passing a referrer, and browser privacy defaults trim what is sent. Many of those direct visits came from social apps. UTM parameters in each bio link recover the source.
What is a good bounce rate for a link in bio page?
There is no fixed benchmark, because each tool defines bounce differently. On a bio page, a bounce usually means a visit with no tap. Track it over time against your own baseline and focus on CTR per block.
Can I see link in bio analytics by country?
Most link in bio tools with analytics include a country breakdown. More.You breaks down views and clicks by source, device and country on every plan.
Do AI crawler visits count as views?
In some tools they do, which inflates traffic. Ask your tool whether it filters known bots out of views. On More.You, you can see how often AI crawlers read your page, so you know how large that number is.
Sources
- Referrer-Policy, default strict-origin-when-cross-origin (developer.mozilla.org, November 2026)
- Engagement rate and bounce rate definitions, Google Analytics 4 (support.google.com, November 2026)
- ChatGPT referral tagging gap, October 2026 (evertune.ai, November 2026)
- More.You plans and analytics history (more.you/pricing, November 2026)
- More.You feature pages: more.you/features/analytics-attribution and more.you/features/ai-native-pages (November 2026)
Platform rules and prices checked November 2026.