
To calculate engagement rate, add up a post’s engagements (likes, comments, shares and saves), divide by a base number, and multiply by 100. The base decides what the rate means: followers, reach, views, or an average across several posts. A post with 360 engagements and 10,000 followers has a 3.6% engagement rate by followers.
That’s the whole formula, and also the trap. The same post can read 3.6%, 6% or 9% depending on which base you pick. Most worry about a “bad” rate comes from comparing a rate built one way against a benchmark built another way.
This guide gives you the four formulas side by side, one worked example run through all of them, a spreadsheet calculator you can copy in five minutes, and benchmarks by follower tier with the method each one uses. It closes on the number engagement can’t give you: what happened after someone tapped your link.
Key Takeaways
- The base changes the number, not the post. One post scores 3.6% by followers, 6% by views and 9% by reach. Pick one formula and stick with it.
- Use reach for your own content decisions. It measures the people who saw the post, so it isn’t dragged down by followers who never saw it.
- Use followers when you compare with other accounts. Followers is the only base anyone can see from outside, which is why brands and media kits use it.
- Benchmarks only work when the formula matches. Socialinsider reports 0.45% on a followers base for brand accounts. Buffer reports a 4.3% median, and its pages give two different bases. Do not compare the two.
- Engagement is a leading signal, not the result. Clicks on your bio page and the sales they lead to are where the money shows up.
How to calculate engagement rate: the 4 formulas
Every formula has the same top line, total engagements. Only the base changes. Choose it by the question you’re asking, then keep it fixed so your weeks stay comparable.
| Formula | Calculation | Best used for | Weak spot |
|---|---|---|---|
| By followers | Engagements ÷ followers × 100 | Comparing accounts, media kits, brand pitches | Penalizes posts that most followers never saw |
| By reach | Engagements ÷ reach × 100 | Judging which content works for your audience | Reach is private, so you can’t compare with other accounts |
| By views | Engagements ÷ views × 100 | Reels and posts that travel beyond followers | Repeat views inflate the base, so the rate runs lower than reach |
| Per post average | Sum of per-post rates ÷ number of posts | Monthly reporting on any of the bases above | One viral post can skew the average |
On Instagram, “views” has taken the place of impressions in Meta’s reporting tools. Meta added a views metric to its insights API and deprecated the impressions and plays metrics for all API versions on April 21, 2025 (Meta Graph API v22.0 changelog, November 2026). If an older guide says “impressions”, read “views”.
Decide what counts as an engagement before you start. Likes and comments are the minimum. Count shares and saves too, since they signal stronger intent than a like (see shares and saves versus likes). Then keep the list fixed.
A worked example with round numbers
Here is one Instagram post from an account with 10,000 followers. It got 300 likes, 20 comments, 15 shares and 25 saves. That’s 360 engagements. Instagram Insights shows a reach of 4,000 accounts and 6,000 views.
- By followers: 360 ÷ 10,000 × 100 = 3.6%
- By reach: 360 ÷ 4,000 × 100 = 9.0%
- By views: 360 ÷ 6,000 × 100 = 6.0%
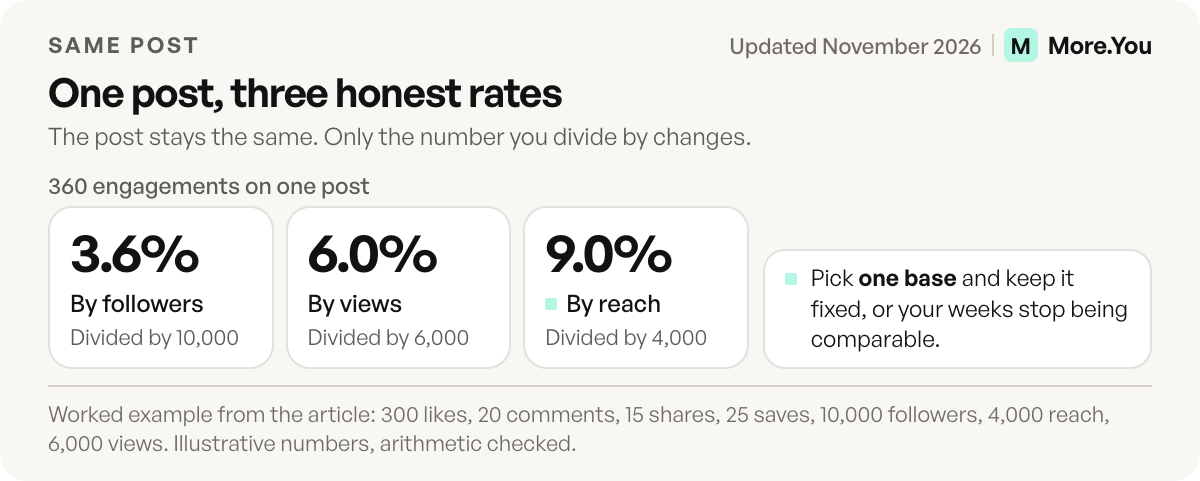
Same post, three honest answers. Reach gives the highest rate because it only counts the 4,000 people who saw the post. Followers gives the lowest because it also counts followers who never saw the post.
Now the per-post average. Say your last five posts earned 360, 200, 450, 150 and 340 engagements. That’s 1,500 in total, or 300 per post. Divided by 10,000 followers, your average engagement rate by followers is 3.0%. The 3.6% post was above your own average, which is the comparison that matters most.
Engagement rate calculator: a spreadsheet you can copy
Online engagement rate calculators work, but most hide which base they use. A spreadsheet shows its math and keeps your history. Set it up in Google Sheets or Excel.
-
Create these column headers in row 1: A Post, B Likes, C Comments, D Shares, E Saves, F Reach, G Views, H Followers.
-
Fill one row per post from Instagram Insights. Record followers on the day you log the post, since the number moves.
-
In I2, total the engagements:
=SUM(B2:E2) -
In J2, rate by followers:
=IFERROR(I2/H2,"") -
In K2, rate by reach:
=IFERROR(I2/F2,"") -
In L2, rate by views:
=IFERROR(I2/G2,"") -
Format J to L as percentages and copy row 2 down for every post.
For the monthly number, you have two choices, plus a check for outliers:
=AVERAGE(K2:K31)
=SUM(I2:I31)/SUM(F2:F31)
=MEDIAN(K2:K31)
The first averages the per-post rates, so every post counts equally. The second divides total engagements by total reach, so big posts weigh more. If one post went viral, also check the third. The median ignores the outlier and tells you what a normal week looks like.
Add one more column, M, for bio link clicks on the days after each post. You’ll need it in the last section.
What is a good Instagram engagement rate by follower tier?
A good Instagram engagement rate is one above the benchmark for your follower tier, measured with the same formula the benchmark used. Smaller accounts usually post higher rates than mid-size ones, and niche audiences can run higher still: Opendorse reports a 5.6% social media engagement rate for student-athletes, against 1.9% for traditional influencers, without naming a platform or formula on that page (biz.opendorse.com, July 2025), and social media for athletes shows how they turn that into NIL deals. Two reports show why the formula matters as much as the tier.
Buffer analyzed more than 27 million Instagram posts from 273,000 accounts and found a median engagement rate of 4.3% (buffer.com, September 2025). Buffer’s pages give two definitions. Its engagement rate page divides total engagements by total impressions. Its benchmarks page divides likes, comments and shares by followers. The benchmarks page does not say which base the 4.3% uses (buffer.com, November 2026). Use the tier values below as a rough guide to how rates fall with account size, not as a target for one formula.
| Follower tier | Median engagement rate (Buffer, base not stated) |
|---|---|
| Under 1K | 5.2% |
| 1K to 5K | 4.6% |
| 5K to 10K | 4.1% |
| 10K to 50K | 3.7% |
| 50K to 100K | 3.6% |
| 100K to 500K | 3.5% |
| 500K to 1M | 3.7% |
| 1M+ | 5.0% |
Socialinsider measures differently: likes plus comments, divided by followers. Across 67.5 million posts from 579,000 brand accounts, its Instagram average was 0.48% for 2025 and 0.45% in Q3 2026 (socialinsider.io, November 2026). Socialinsider doesn’t publish rates by tier, and its sample is brand accounts only.
So a 1% rate by followers is roughly double Socialinsider’s brand average. Buffer’s 4.3% cannot be set against it until Buffer states its base. Compare yourself against a benchmark that names its formula, then against your own last 30 posts. Your own median is the benchmark you can act on.
Instagram engagement rate by format
Format changes the rate too. Socialinsider’s Instagram benchmarks give average rates by followers for each format, from likes plus comments (socialinsider.io, November 2026):
| Format | 2024 | 2025 | Q3 2026 |
|---|---|---|---|
| Reels | 0.50% | 0.52% | 0.48% |
| Carousels | 0.55% | 0.55% | 0.50% |
| Images | 0.45% | 0.37% | 0.35% |
The gaps are small, and the sample is brand accounts only. Use the table to compare your own formats against each other, not to judge a single post. Log a format column in your spreadsheet and check which format has the higher median over 30 posts. Socialinsider’s rates are far below Buffer’s tier values because they use a followers base and count only likes and comments, which is one more reason to compare a benchmark only with a rate built the same way.
Engagement rate mistakes and how to fix them
Most “bad” rates come from a mismatch, not from weak content. Check this list before you change what you post.
| Mistake | What goes wrong | Fix |
|---|---|---|
| Comparing a rate by reach with a benchmark by followers | Your rate looks too good | Recalculate with the benchmark’s own base |
| Changing the engagement list each month | Weeks stop being comparable | Fix the list: likes, comments, shares, saves |
| Using today’s follower count for old posts | Old rates look too low after growth | Log followers on the day you post |
| Judging a post after one day | Late views and saves are missing | Read each post at the same age, such as 7 days |
| Averaging when one post went viral | One post lifts the whole month | Report the median next to the average |
Why engagement rate is not the number that pays you
Engagement rate tells you the post landed. It doesn’t tell you whether anyone did the thing you posted it for: bought the preset, booked the session, joined the list. Those actions happen after a tap, on your bio page, which is outside what an engagement rate can see.
The chain runs views, engagements, profile visits, bio page views, link clicks, then a sale or sign-up. Each step loses people. A post can win the first two steps and lose the rest.
For illustration: take two posts from the same account. Post A, a trend Reel, earns a 9% engagement rate by reach and sends 12 clicks to the shop link. Post B, a plain carousel about the new product, earns 4% and sends 80 clicks. If you plan next month on engagement rate alone, you make more of Post A and sell less.
So track three numbers next to engagement:
- Bio page views per post. How many people a post sent to the page.
- Click-through rate per link. Which link those visitors chose. Our guide to link in bio metrics that matter covers which of these to check weekly.
- Clicks and sales by source post. Which post drove the click that became money. This is what post attribution for creators solves.
Engagement rate stays useful as an early read on content and as the number brands ask for in a creator media kit. For planning, the post that sends paying clicks wins.
Where More.You fits
A More.You page reports views, clicks and click-through rate per block, by source, device and country. Free includes basic views and clicks with 30 days of history. On Pro, attribution ties each click to the post and platform that sent it. More.You also adds UTM tags to outbound clicks automatically, so the numbers for column M come from your page’s analytics (more.you/features/analytics-attribution, November 2026).
Pin the link that matches your newest post, so a viewer who taps through lands on what the post promised. Then log the bio link clicks in column M next to each post’s rate. Your engagement rate tells you which posts people liked. Your bio page tells you which posts sent clicks. Create your More.You page and put both numbers side by side.
FAQ
What is the formula for engagement rate?
Engagement rate equals total engagements divided by a base, multiplied by 100. Engagements are usually likes, comments, shares and saves. The base is followers, reach, views, or an average across posts. A post with 360 engagements and a reach of 4,000 has a 9% engagement rate by reach.
Should I calculate engagement rate by reach or by followers?
Use reach to judge your own content, because it only counts people who saw the post. Use followers when you compare with other accounts or put numbers in a media kit, because reach is private and followers is public. Pick one base per purpose and keep it fixed.
What is a good engagement rate on Instagram?
The answer changes with the formula. Buffer reports a 4.3% median across 27 million posts, falling from 5.2% under 1K followers to 3.5% at 100K to 500K, and its pages do not agree on the base. Socialinsider reports 0.45% on a followers base for brand accounts in Q3 2026. Compare against a benchmark that names its formula.
How do I calculate average engagement rate across posts?
Calculate each post’s rate, add them, and divide by the number of posts. In a spreadsheet, use the AVERAGE function over the rate column. If one viral post skews the result, use MEDIAN instead, which shows a typical post.
Do engagement rate calculators count saves and shares?
Some do, some don’t, and many don’t say, so one post can score differently across tools. A spreadsheet with your own columns fixes that: you decide what counts, and the formula stays visible.
Sources
- Meta Graph API v22.0 changelog: views metric added, impressions and plays deprecated April 21, 2025 (developers.facebook.com, November 2026)
- Instagram engagement rate by follower count, 27 million posts from 273,000 accounts (buffer.com, September 2025)
- Engagement rate definition, impressions base (buffer.com, social media terms page, November 2026) and the benchmarks page, followers base (buffer.com, November 2026)
- Instagram benchmarks, 67.5 million posts from 579,000 brand accounts; likes plus comments divided by followers (socialinsider.io, November 2026)
- Opendorse, NIL at Four: Monetizing the New Reality, 5.6% student-athlete engagement rate (biz.opendorse.com, July 2025)
- More.You analytics and attribution (more.you/features/analytics-attribution, November 2026)
Platform rules and prices checked November 2026.